quick review:
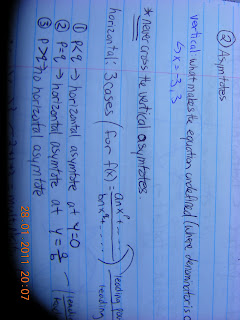
oh man why is it sideways!@!@! ugh.. okay. ... this is for sketching rational functions, so it looks like a giant fraction. vertical asymtotes are easy to determine, as they are the roots at the denominator of the fraction. now, to find the horizontal asymtote, there are three options. we look at the degrees (if they are factored) or the exponent of the leading polynomial (so the greatest exponent number) for both the numerator and denominator.
IF... the numerator's exponent is less than that of the denominator (p<q), then your horizontal asymtote is at y = 0
if p = q, then your horizontal asymtote is at the leading coefficient of the numerator divided by the leading coefficient of the denominator.
if p > q by one, then you have an oblique asymtote. this is just a straight line in the form y=mx+b. to find this equation, just divide the numerator by the denominator, and drop the remainders (they are not important). then you should have a line in the form y=mx+b which is going to be your oblique asymtote.
if p>q by more than one, you still divide the numerator by the denominator, but you'll get a quadratic function, or greater. that will be your asymtote. (this particular case is not on the exam).
keep in mind that the horizontal asymtotes only guide the end behaviours of the graph.
this is for non rational (regular?) functions:
even means: degree of the function is an even number.
odd means: degree of the function is an odd number.
negative means a is negative (or the leading coefficient is negative).
postitive means the leading coefficient is positive.
here is what a positive, even function should look like: it starts at the 2nd quadrant, and ends in the first.
this is a negative even graph, opposite to the positive even graph, it starts in quadrant three and ends in quadrant four.
this is an example of a negative but odd graph. it starts in the second quadrant and ends in the 4th quadrant. note that unlike the even graphs, one section is in a negative quadrant, while the other is in a positive quadrant.
this is an example of a positive but odd function. it should start in quadrant 3 and end in quadrant 1.
here are some sketching questions i am having trouble with:
my graphing calculator indicates that my graph should be a negative curve on the left side of the y axis (in quadrant 3), and a positive curve on the right side of the y axis (meaning the graph is in quadrant one).
where did i go wrong? or is it just the calculator.. having trouble with asymtotes?
the function is f(x) = (x^2 + 1)/x
apparantly i'm wrong here too... where did i go wrongg? f (x) = (x^3) / (x+1)
for this, i'm supposed to come up with the function that describes this graph. i didnt get it T_T i think the y-intercept is a bit confusing? i couldnt plug it in... f(0) = -1 right? it didnt work out nicely?
remember, if there are the same root(s) on the numerator and denominator, this means you have a hole in the graph. it is not necessary to include these when you're doing the sign chart since they cancel out anyway. the only thing you have to do, is to draw a hole on the graph where it would normally just be a line. just make a circle where the graph meets the root.
also, when drawing even/odd curves, the higher the exponent, the more exaggerated the bounce/influxion.
on the exam, there will be a question where the properties of the graph are described, and the question will require a graph to be drawn from those properties (concave up/down, increasing/decreasing intervals, intercepts, and points).
do not forget to label all oblique, vertical, and horizontal asymtotes, intercepts, points given, and don't forget to put in the direction of the graph (little arrow).
there is no vertical asymtote where the denominator is zero. this is undefined.


No comments:
Post a Comment
Feel free to leave a comment.